
How Much Is My Crescent Park Home Worth?
April 14, 2022
Since the start of 2021, homes in Palo Alto’s prestigious Crescent Park neighborhood have held their value and more. We’ll look at sales data in (mostly) visual form.
At the Young Platinum Group, we use data like this to help our sellers command top dollar, and our buyers spot deals. If you are looking for help in your next real estate transition, contact us to see if we can help. A complete analysis of your home’s unique strengths would need us to assess its condition and your goals, which we’d be delighted to do. But in advance of that, let’s go!

Crescent Park’s top sale since January 2021 was 445 Hale, at $11,350,000. There were only 41 sales, spread geographically across the neighborhood

50% of Crescent Park sales since January 2021 were between $4.38 million-6.09 million.

There is a weak trendline down among Crescent Park sales prices. Should a homeowner here worry? No; $/ft2 is rising, as we shall see soon The apparent decline in prices reflects the specific houses, not the trend for a house.
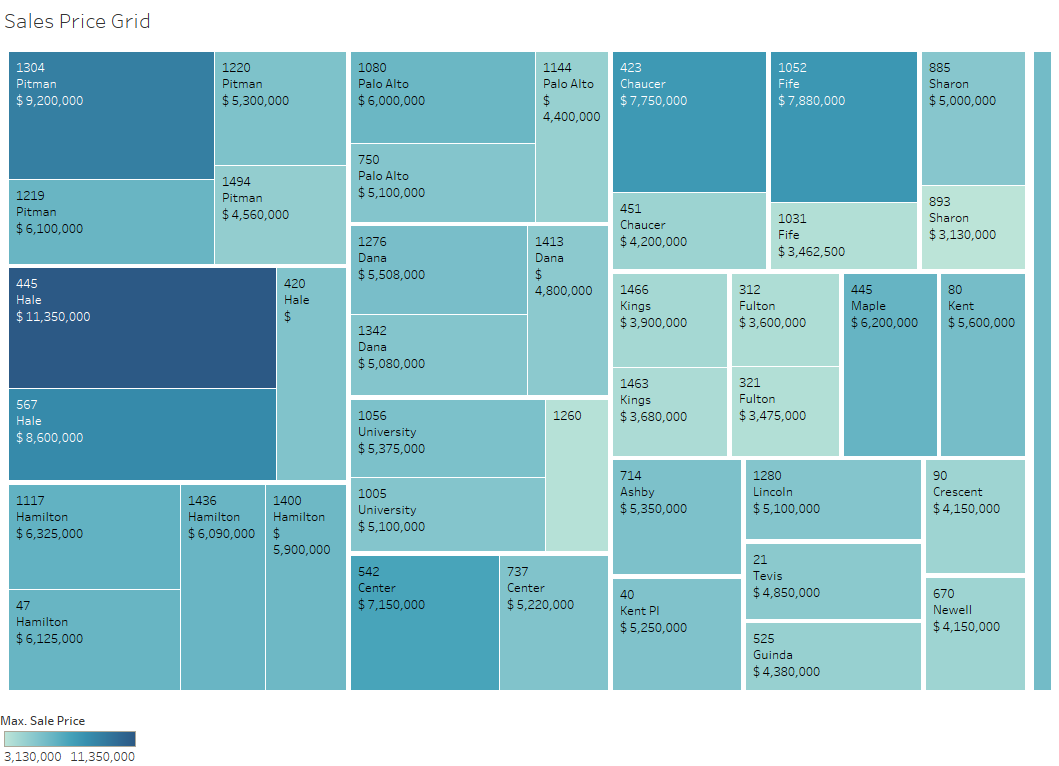
If we represented sales price as area, we’d get the image above. Hey, we just did!

Dollars per square foot is the most common way to equalize all things about differing houses. This metric rewards newness, beauty, functional floorplans, large lots, and small houses. 1463 Kings Lane was the winner due to its modest 1,310 ft2 of house; underbuilt for its 7,471 lot, and on a quiet street.

Crescent Park’s median $/ft2 was 1,818, while 50% of houses ranged between 1,613 and 2,012 $/ft2.

If we plot sales over time, we see a modestly rising $/ft2 trendline. Due to the comparatively modest lot sizes, Crescent Park did not appreciate as strongly as Los Altos Hills or Portola Valley; large lots were strongly favored during the pandemic.

567 Hale weighs in as the biggest house sold in the past 1.25 years. The average house sold was 3,002 square feet big.

Sizing Crescent Park sales by square footage of house produces the image above.

The largest lots in Crescent Park, not surprisingly, tend to be near the “crescent” of San Francisquito Creek.

Median lot size was 8,862 ft2 over the houses that sold since January 2021.

Newer construction is sprinkled here and there across Crescent Park. These “build dates” do not reflect major internal renovations.

The most common bedroom count was 4. 1080 Palo Alto Avenue won the prize for most bedrooms (7).

22% of Crescent Park homes sold had a pool.

It is jaw-dropping to those moving to the area that $5-10 million only buys 2 garage spaces at best, but that is the way Crescent Park rolls.

Crescent Park is known for a wide variety of home styles. The eclectic architecture and landscaping is part of the charm of this neighborhood.

Crescent Park has it all! These categories are chosen by the listing agent to describe the house, so is somewhat subjective.

Want to sell your Crescent Park house but are worried that you have no AC? Fear not: 44% of homes sold here last year don’t have classic “forced air” cooling.

Do you think all transactions are won by “all-cash” buyers? Think again! 63% of sales here involved a lender.
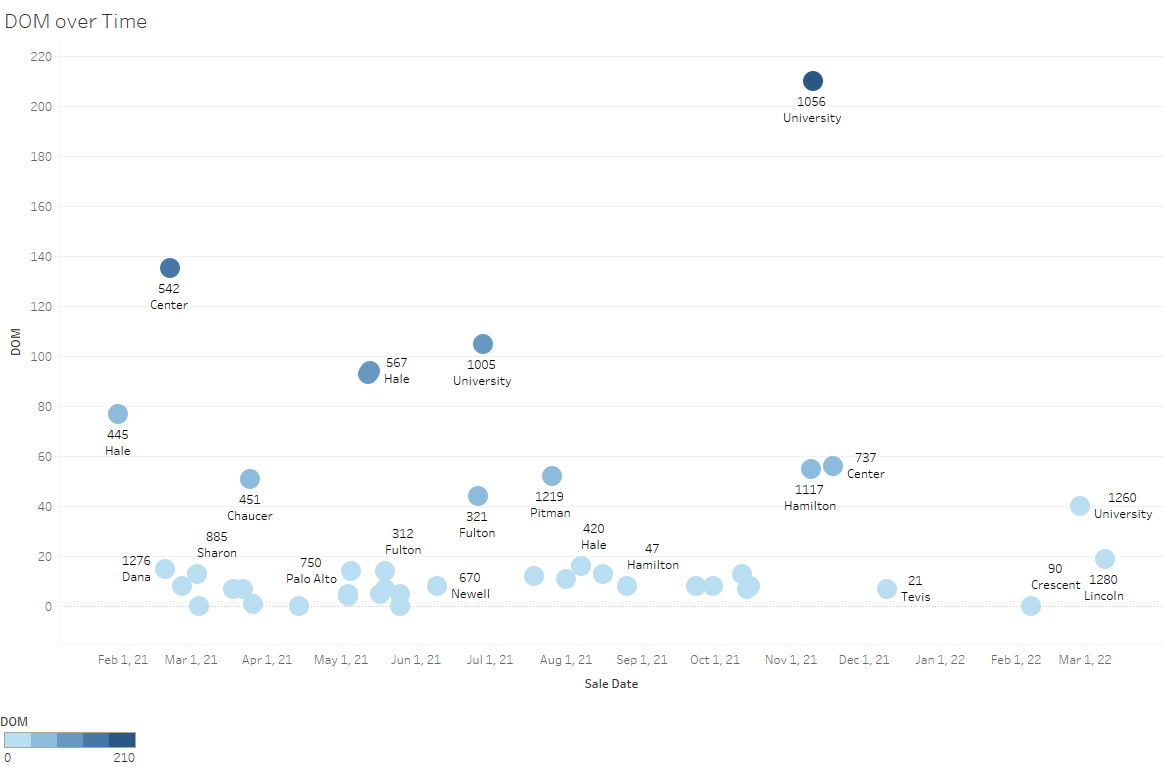
Selling your house here and wondering how long it might take? 11 days is the median over the past 1.25 years. Homes on University Avenue are the notable exception.

50% of Crescent Park sales lasted 7-44 days on market, which is slower than the Silicon Valley average.

