
13 Pictures that Explain the North Palo Alto Real Estate Market
September 11, 2023
Interest rates soared in mid-2022, which changed everything in local real estate. The current period since “the Shift” does not look the same as pre-COVID appreciation or the pandemic housing pandemonium. So what does the market look like now?
We’ll look at some traditional measures like sales price, dollars per square foot, and days on market. Then we’ll go deeper, with some rarely shown data: where is new construction located? Am I likely to get air conditioning? Do cash buyers dominate the market?
You can view the underlying data and the methodology note… but let’s just get into it!


Sales Price
Where Did Sales Happen?
The highest sale price between June 1, 2022 and Sept 7, 2023 was 1934 Waverley at $28,500,000. The median was $3,887,500. 50% of all sales had prices between $3,258,000 and $5,100,000. The most expensive sales were in Old Palo Alto and Crescent Park, but even a $6.5 million sale would only get you a small blue dot on this map:


How Did Sales Price Change Over Time?
The market for high-end sales shut down between September 2022 and April 2023, but the spring and summer seasons have seen higher-end properties move again. Buyers (who could suddenly afford less house) and Sellers (who would be forced to pay high mortgage rates on the place they moved to) have somewhat accommodated to this new market reality, though low seller inventory due to interest rate lock-in is the driving feature in our market today.


Dollars Per Square Foot
Where were the “Nicest” Properties Sold?
The median was $1,885/sf during this time period, and 50% of all houses sold between $1,602/sf and $2,198/sf – quite a tight band. Note how distribution of the “nicest” houses is more broad-based using $/sf rather than absolute sales price.


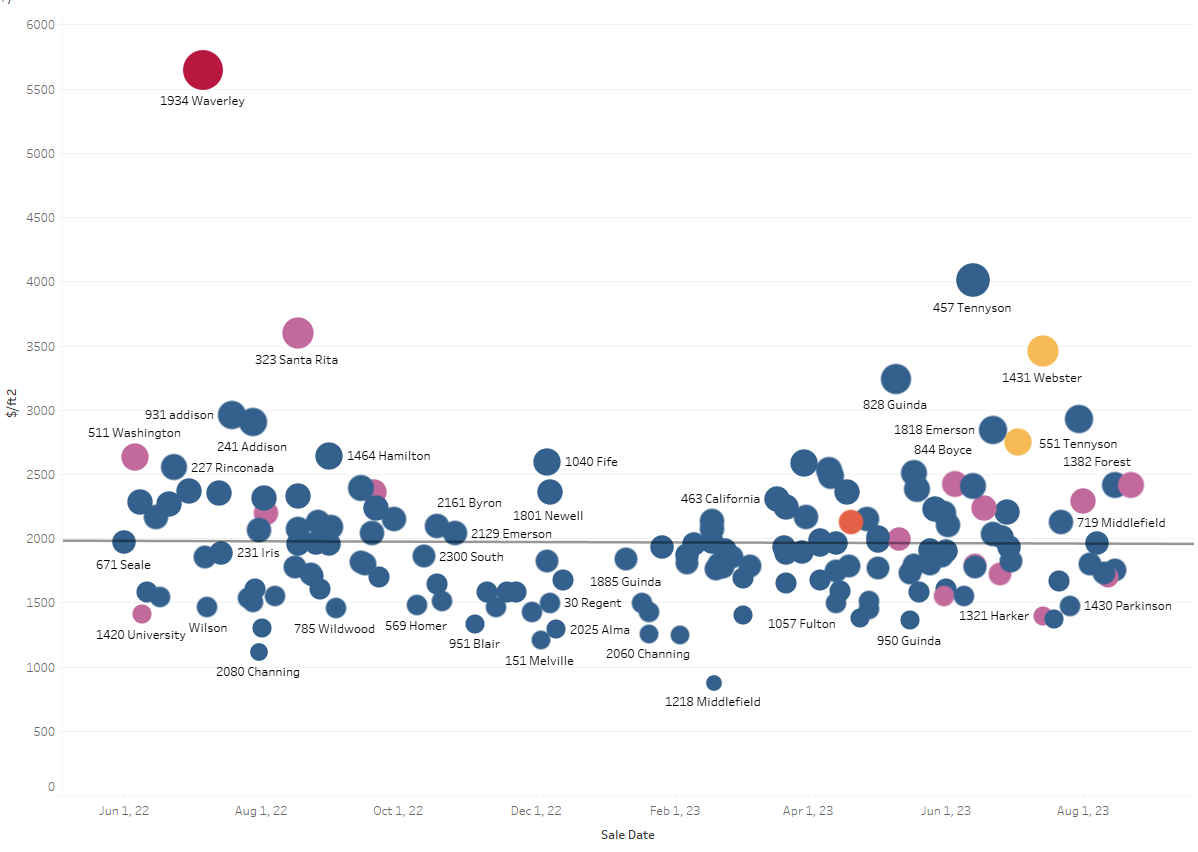
How Has Dollars Per Square Foot Changed Over Time?
The “valley” is clear on the chart below: the nicest houses did not come on the market between September 2022-April 2023; the inventory then was older, smaller, less prestigious, and less beautiful than earlier. Happily, nice houses are increasingly coming back.


Days On Market
How Long Do Houses Take To Sell?
This chart below understates the time between listing and sale, because it does not sum up multiple consecutive listings of the same property. 200 Lowell, the highest at 323 days, actually listed three times; it has actually been available for years.
The median was 13.5 days, and 50% of North Palo Alto homes sold between 8 and 40 days. Days on market has not altered much during this time period.


Market Characteristics
Where Were the Biggest Houses?
Relative to peer locations, Palo Alto is not known for our large houses. Old Palo Alto, Crescent Park, and Community Center are larger than other areas. The median house size was 2,190sf, and 50% of all sales were for houses between 1,678-2,840sf.


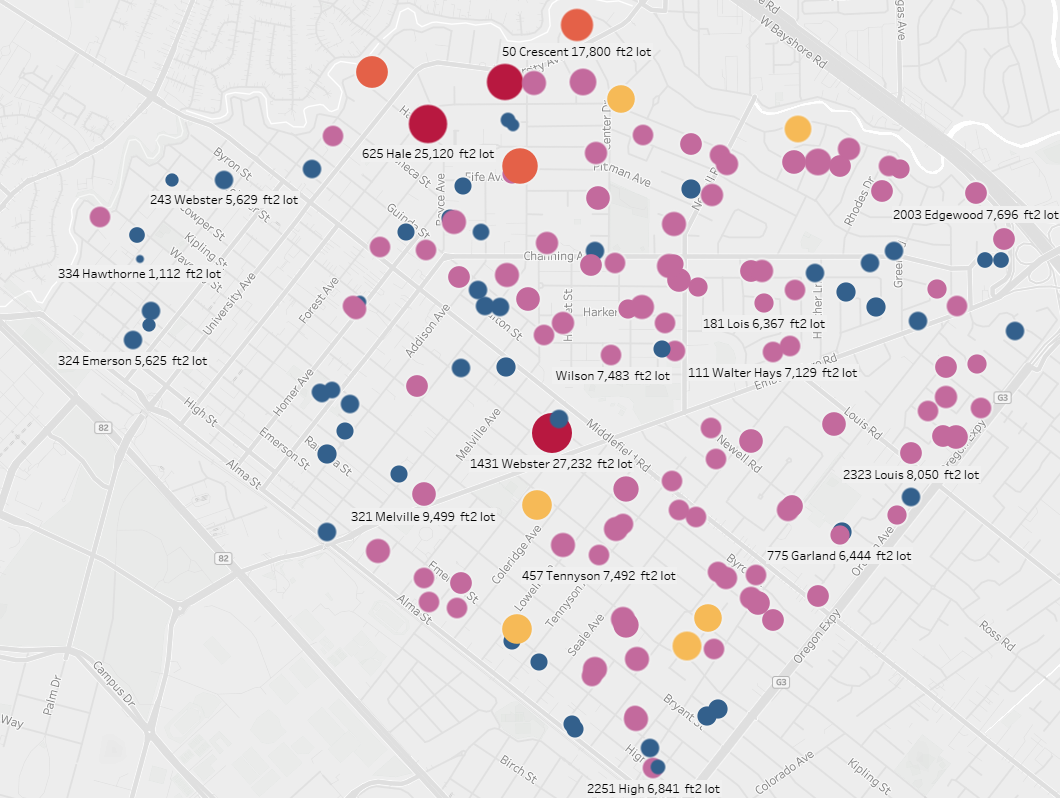
Where Were the Biggest Lots?
The median North Palo Alto sale was 7,445sf, and 50% of sales were for a house on 6,000-8,579sf of land. Crescent Park dominates the “large lot” competition.


Where Can I Buy a New Construction?
New construction (in light green) is spread fairly evenly throughout North Palo Alto. A healthy amount of home sales are for houses originally built over a century ago! Note that the area around Downtown, Professorville, and Old Palo Alto (left side) are much older; these were settled earlier than Green Gables and Community Center (left side).


How Many Bedrooms Am I Likely to Get?
3 bedroom houses are the most common by a small margin, closely followed by 4. There are some houses with 6+ bedrooms, but we should consider neighboring towns (that allow for larger lots) if this is required.


Are There Many Pools in North Palo Alto?
We *are* in California, but Palo Alto does not uphold the Los Angeles image very well; only 10% of sales featured pools.


Where Can I Park My Car in North Palo Alto?
2-car garages are the most common (54% of sales), but one garage space (25%) or none (19%) are common also. This does not include driveway or street parking, which is common (a fact sometimes surprising to buyers moving from New York or San Francisco).


How Common Is Air Conditioning?
With climate change, it is increasingly desirable to have central air conditioning or “split systems” that chill the air. However, only 52% of sales were for houses with AC of any sort.


What Are My Odds If I Need a Loan?
During this difficult period for buyers, where interest rates were high and affordability therefore low, cash buyers must have dominated, right?
Wrong! Only 37% of transactions were all-cash, while 57% were financed. (6% were “other”: not reported, seller-financed, or some other unusual situation).


How Do I go About Buying or Selling a House in North Palo Alto?
Work with experts like us! Contact us for a free consultation about buying into North Palo Alto or Silicon Valley in general, or selling your property. We’ve helped clients have a lot of success in this area, and would love to give some personalized attention to your goals for buying or selling in our area.
About the Authors/Datamancers

Gloria and John Young specialize in Palo Alto, Atherton, and surrounding areas. We have lived in Palo Alto for 16 years and admittedly are somewhat partisan about the place. We work with buyers, sellers, and builders to enhance exceptional lives in the finest homes in the heart of Silicon Valley. Would you like this sort of data on your side in your next real estate transaction? Or a complimentary analysis of what your home is worth in the current and ever-evolving market? Contact us to start. This sort of original analytical work, customized on your behalf, with our fabled customer service, can be deployed for your needs to make your next move a smooth and happy one. We proudly affiliate with Golden Gate Sotheby’s International Realty for our realty activities, and the Peninsula’s finest builders, architects, and designers for our development projects.