
Will Silicon Valley Home Prices Crash?
Updated and Revised January 27, 2026
Executive Summary
Probably Not!
Palo Alto median dollars per square foot rose from 389 to 2,045 since 1998.
Recent housing booms have lasted 7.2 years and see property values rise by 75%.
Busts are shorter and milder: 1.1 years and a 15% decline in value.
The boom times are 5x the downturns, in both scale and duration.
It is hard to time the market, so it is better to buy in if the timing is right for you.
The “Crash Thesis”
It’s been a tough decade for would-be Silicon Valley homebuyers who have been waiting for “the crash”. Prices have been relentlessly rising year after year despite problems that might have derailed it. Pandemics, interest rate hikes, and famously conservative Planning Departments have all tried but could not derail the appreciation.
But perhaps things are changing—the rate of increase in housing prices is slowing. Global trade patterns are shifting rapidly. “Political risk” has exploded. AI might put every second coder out of work. The stock market is overvalued. Any of these could disrupt the seemingly endless upward trajectory of house prices.
Prospective Buyers might be tempted to wait, hoping for the slowing growth to tip into decline, or even for home prices to crash. But as this analysis will suggest, they may be waiting a long time, and for little upside. We’ll zero in on Palo Alto— the “heart” of Silicon Valley— but neighboring cities show the same patterns.
To believe that waiting for a crash is the correct course of action, a buyer might believe that housing downturns last a long time, that prices will fall materially, and that it is possible to time the market. In fact, all of these arguments are suspect.
The Allure of a Crash
“Prices are unjustifiably high now. I’ll swoop in after the crash that is sure to come.”
The stock market crash of 1929 is the dream of hopeful buyers. They hope that the current market prices are stressed to the breaking point and about to catastrophically collapse to significantly lower levels.
It’s a satisfying hypothetical narrative, but has the actual history of Palo Alto shown anything so dramatic?

(BETTMANN/GETTY IMAGES)

Palo Alto’s Actual Home Price History
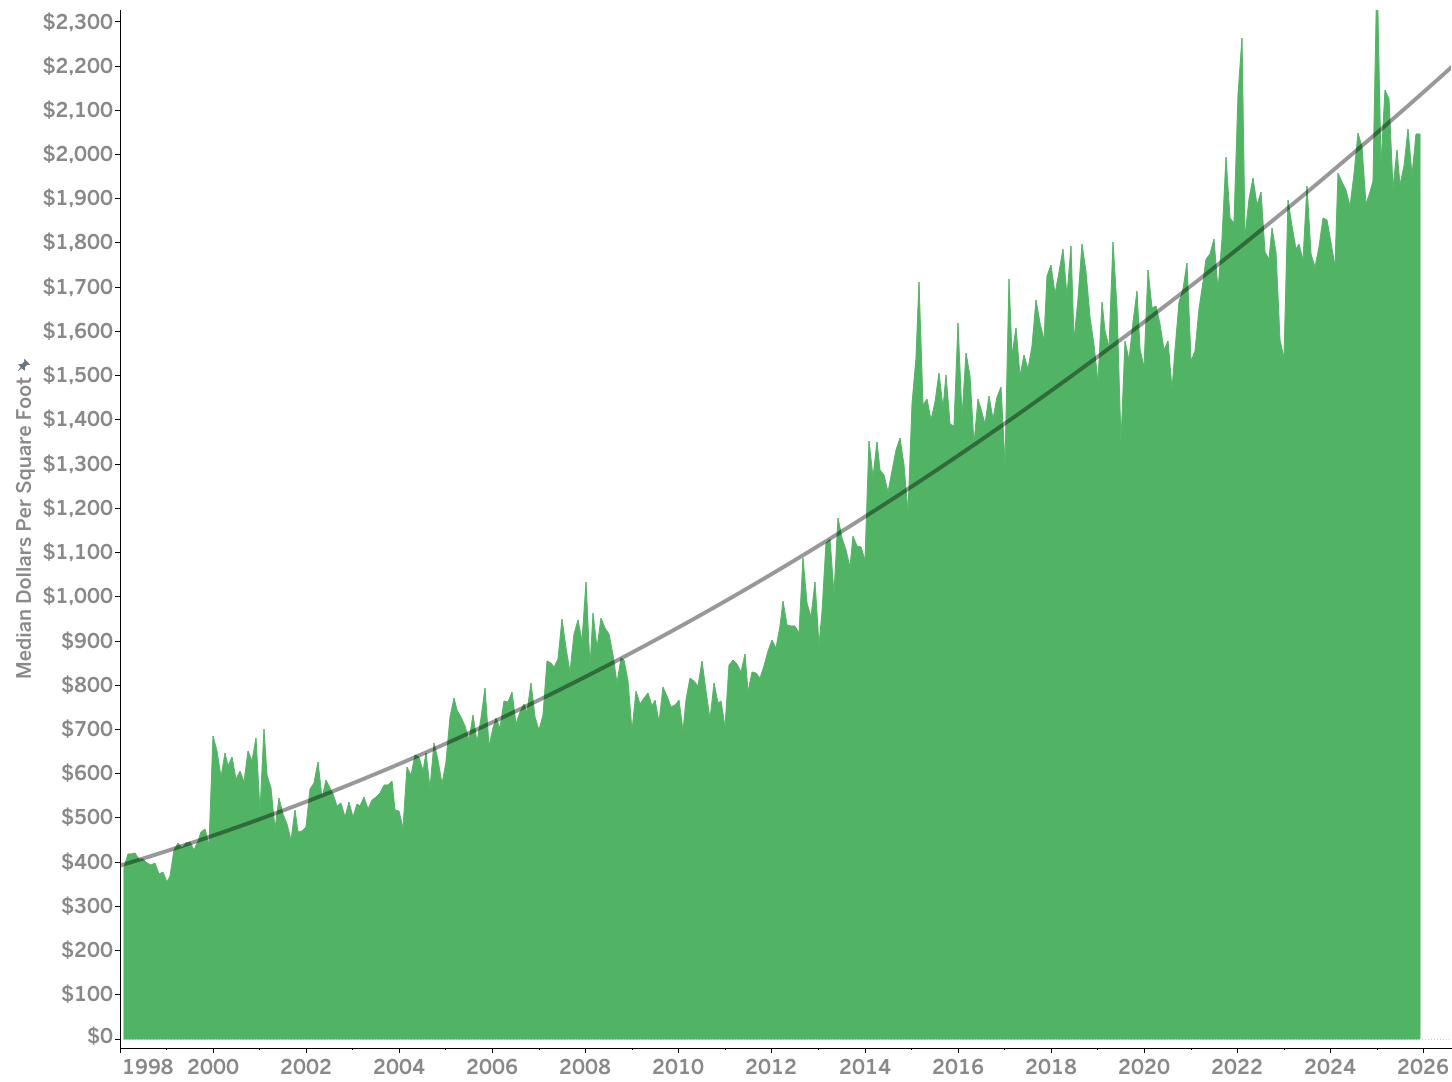
“Hey wait… this looks like a smooth-ish upward trajectory,”
Indeed it is, astute reader. What we see above is the median dollars per square foot of all the on-market transactions in Palo Alto since the start of 1998. Median is preferred over average, because there can be some really affluent homes that distort averages. Dollars per square foot is preferred over sales price because it equalizes for the trend towards bigger homes.
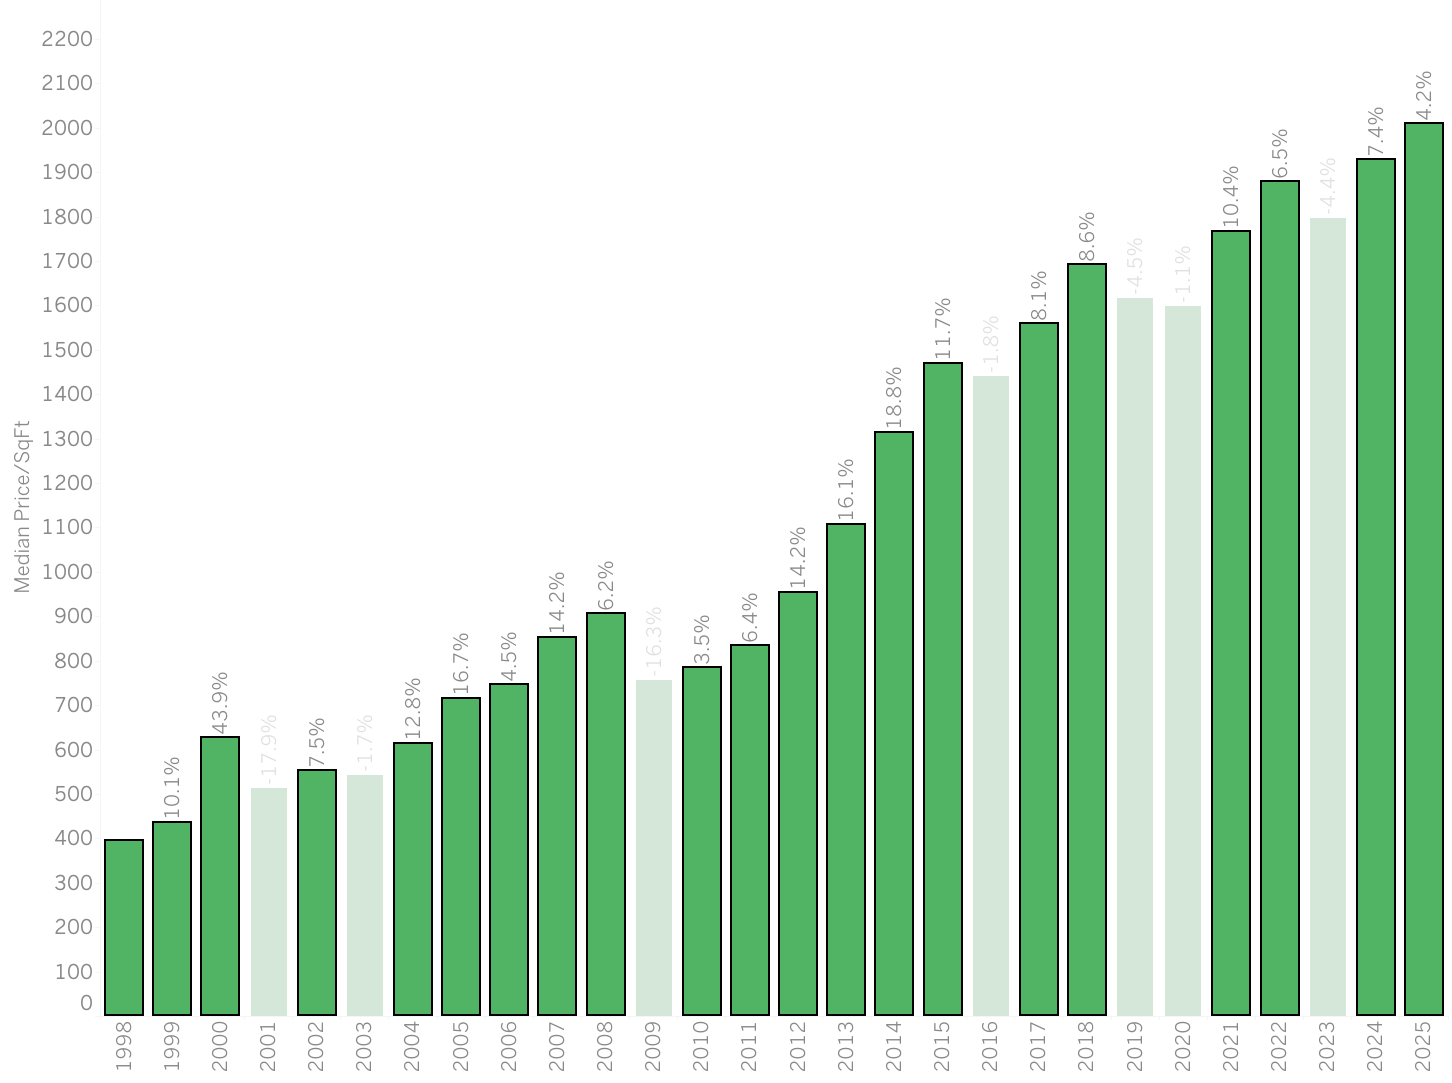
“So most of the time Palo Alto’s property market appreciates?”
Yes, in 21 of the past 28 years:
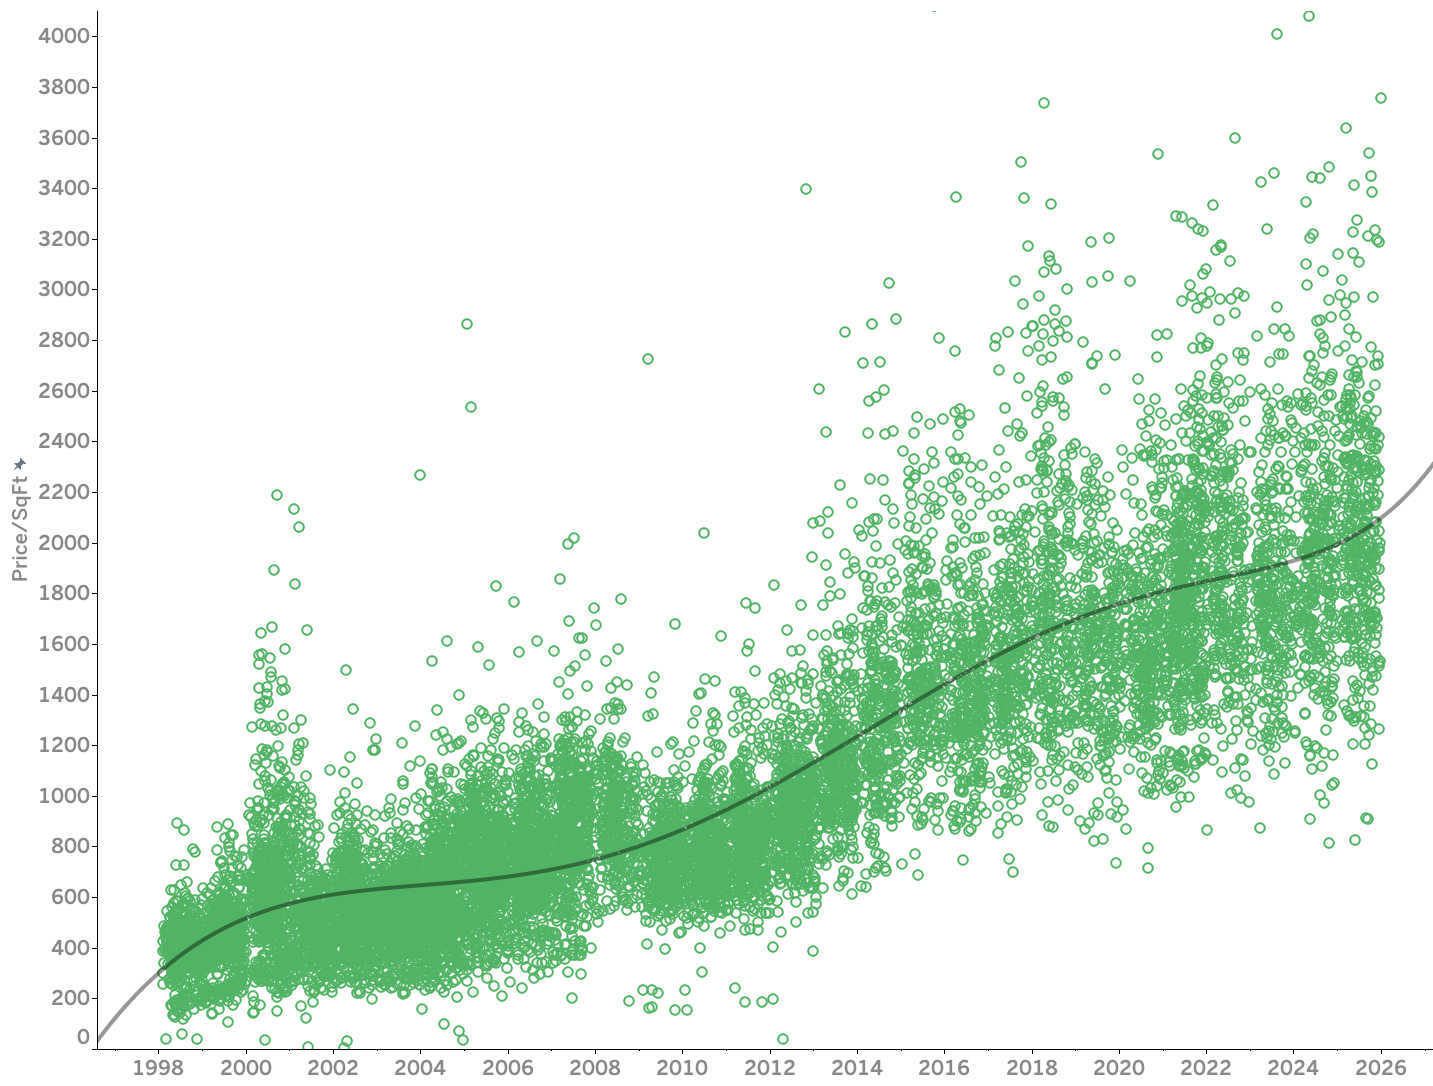
“But how tightly are the base data packed around the median?”, you ask, not wanting to be fooled by lies, damned lies, or statistics.
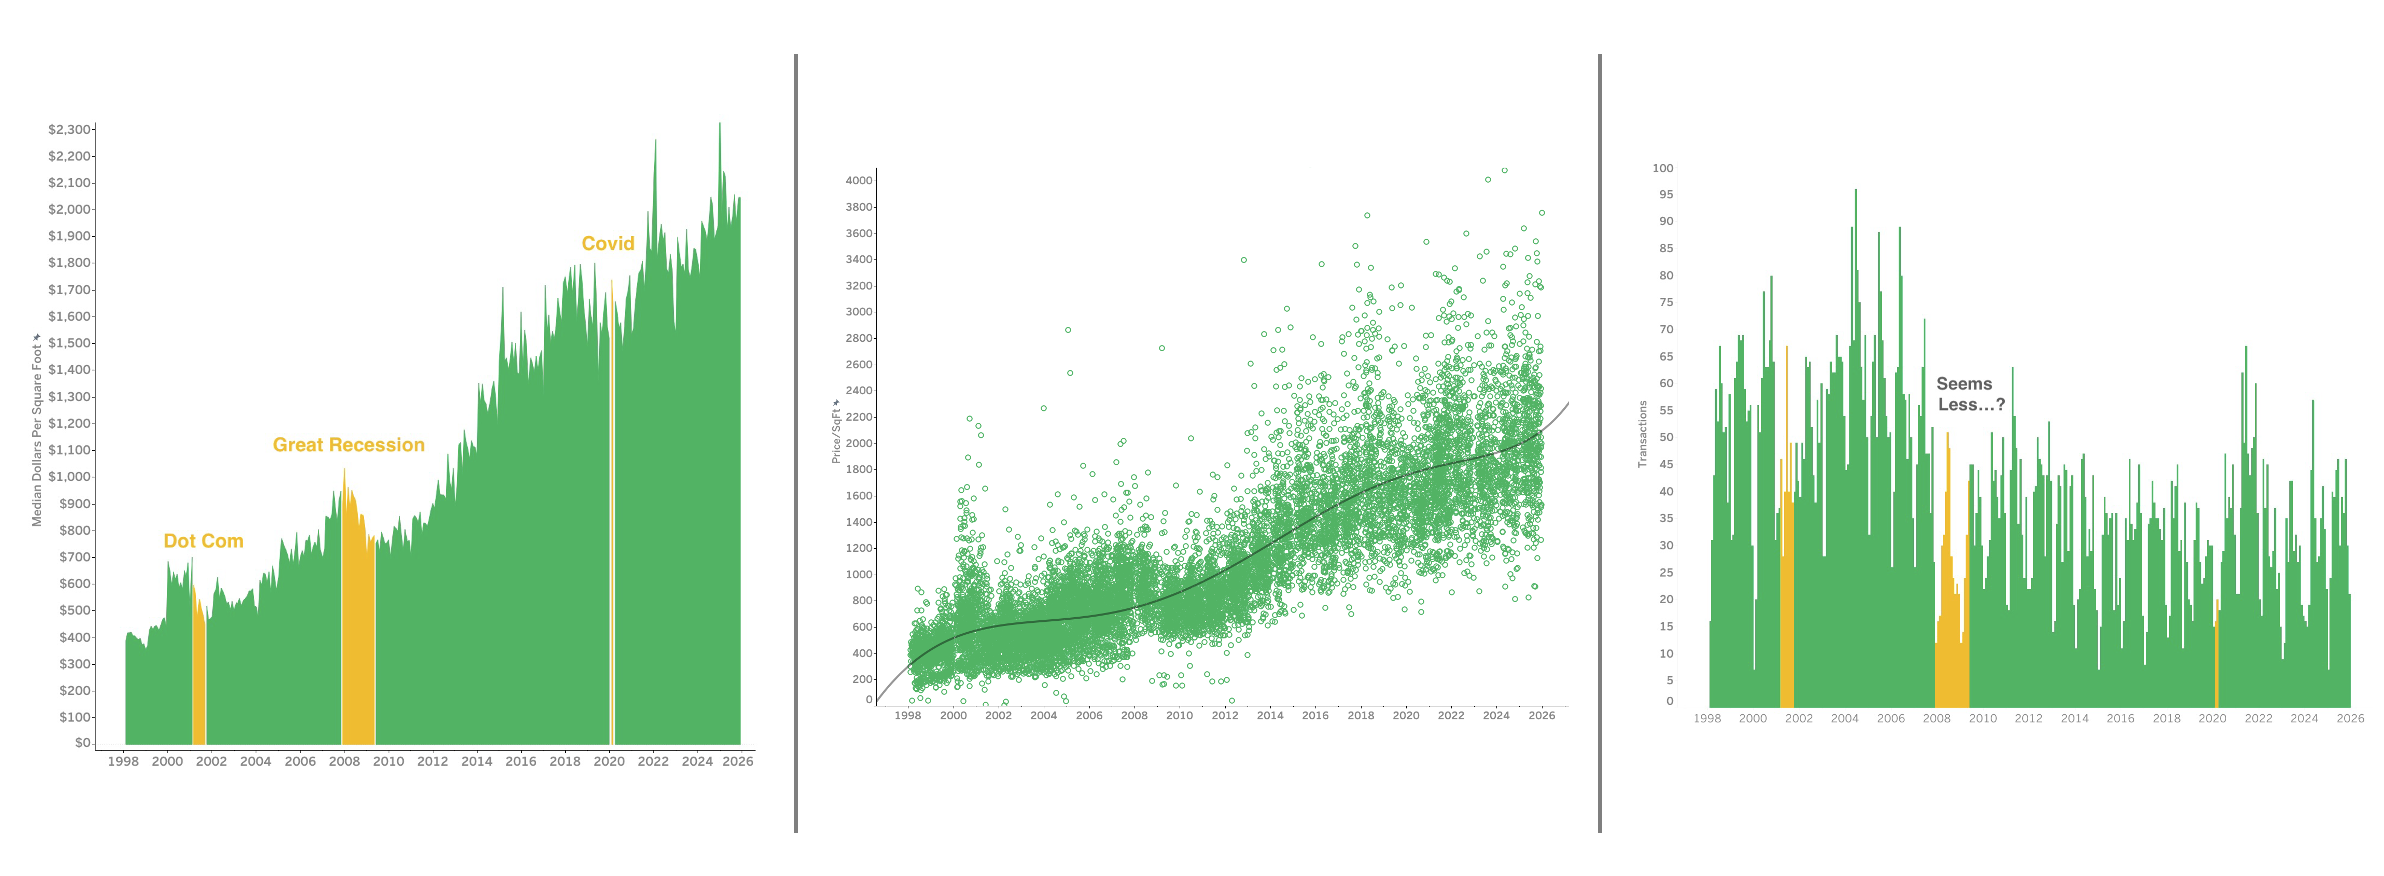
Here is every on-market transaction in Palo Alto for 28 years. See that spike in 2001 of high-end homes transacting after the Dot Com bust? Or the downward bulge in the Great Recession? Or the progression from more clustered before the Great Recession to more scattered afterwards? These are interesting sidebar stories, but don’t change the main narrative: Palo Alto real estate has been a great investment that generally appreciates.
“But the Dot Com Crash and the Great Recession destroyed housing values. I remember those recessions vividly!”
Yep, they really happened. Here are those periods highlighted, plus the COVID-19 recession also (recall we were briefly in dire straits before the post-Covid boom?):
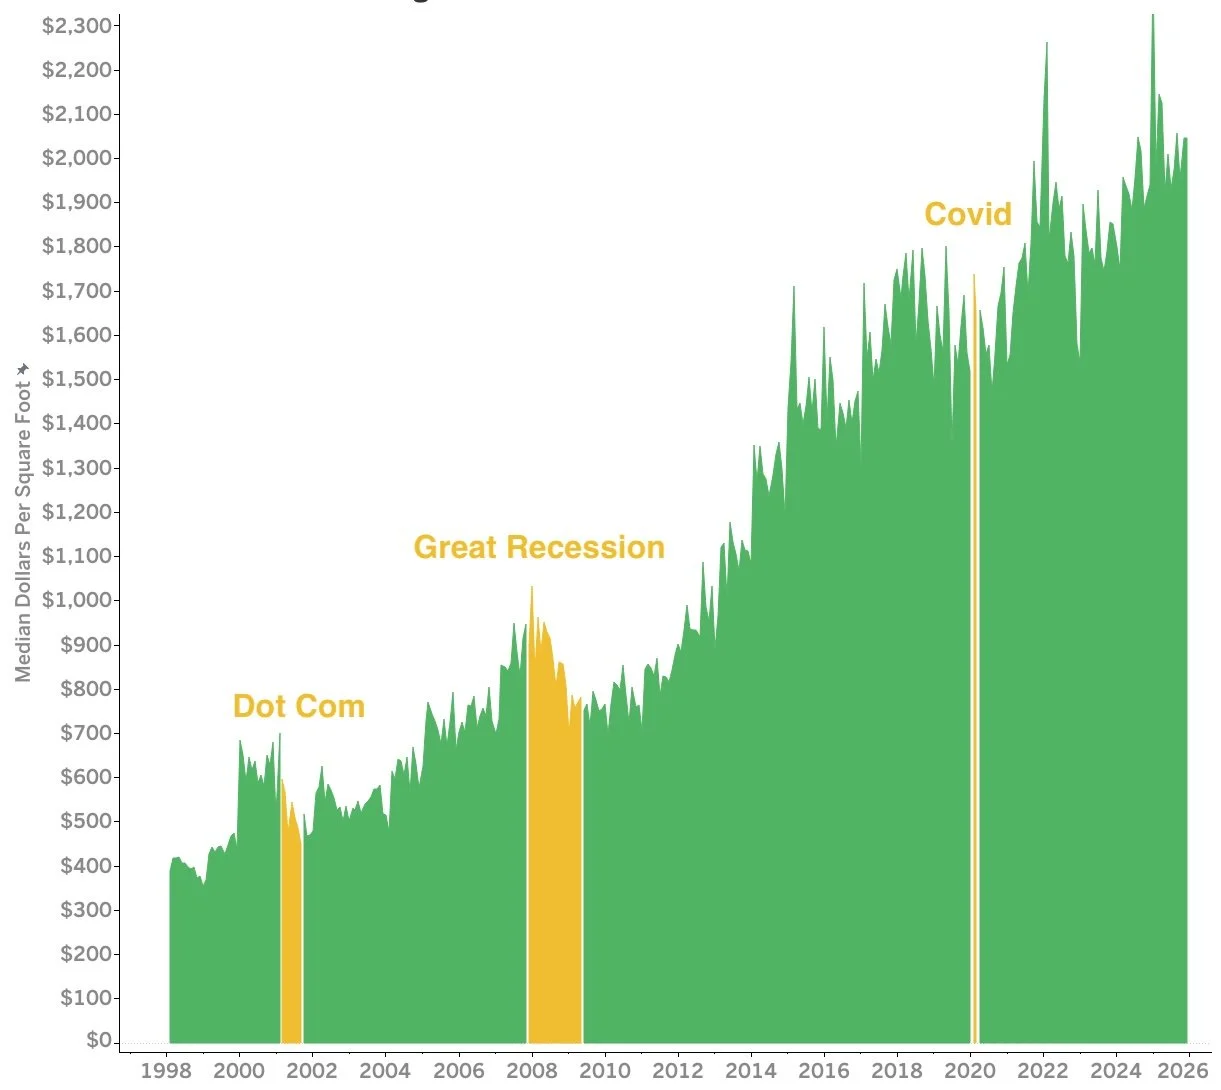
Recessions are real, and they *are* associated with material declines in housing value.
The periods colored in yellow above are defined by the National Bureau of Economic Research (NBER). Their definition of a recession is “a significant decline in economic activity spread across the economy, lasting more than a few months, normally visible in real GDP, real income, employment, industrial production, and wholesale-retail sales.” The rule of thumb is that a recession is when there are two consecutive quarters of negative GDP growth. The reality is more nuanced, but that is roughly it.
It's clear that the green periods are longer and define the direction of the market much more than the yellow periods. Recessions are modest downward adjustments to an asset class that is unambiguously appreciating.
“Well we are heavily equity-compensated in Silicon Valley. Maybe recessions are not the right metric; surely stock market crashes will hurt Palo Alto housing”
You are so correct, dear reader! “Bear markets” are when equities drop 20% or more. This can apply to an individual stock, a sector, or and index. We use the Dow Jones Industrial Average (DJIA) in this analysis.
It’s a nice argument, though it still gets applied to the same upward chart of median home prices, so we already know the results. If we represent bear markets in blue, we can see that the start and end dates are not exactly the same as those for recessions, but are also associated with housing downturns:
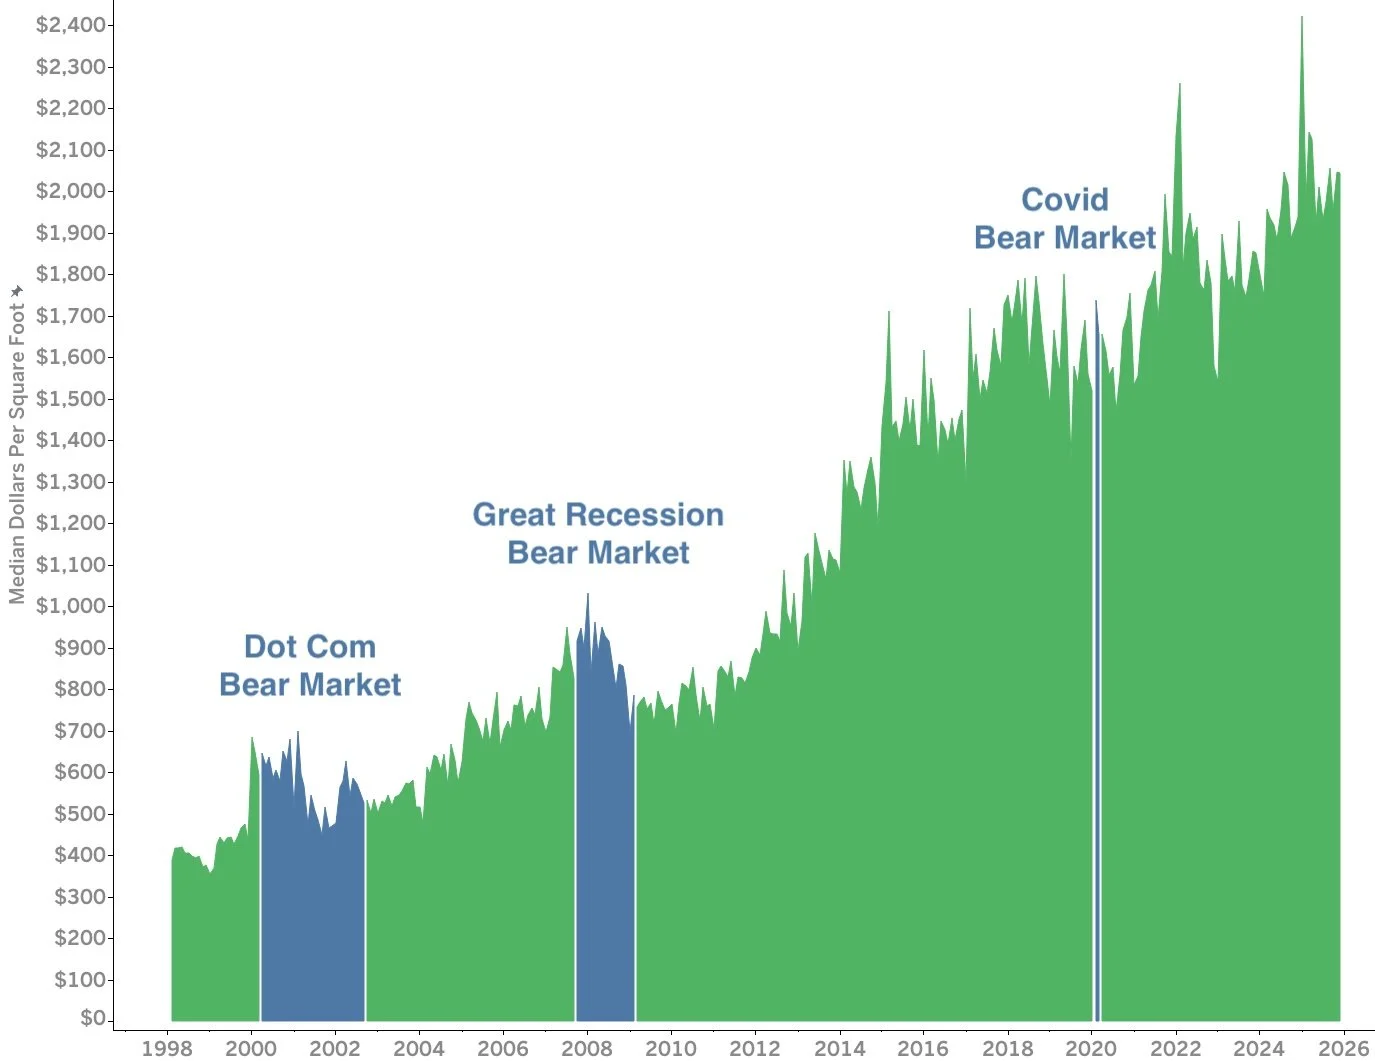
Despite the fact that bear markets in equities cause downturns in Palo Alto property prices, they are short sawtooths down on a curve that rises generally up and to the right.
So whichever way one chooses to define a downturn: based on Recessions or Bear Markets… and the two are typically correlated… a downturn in Palo Alto housing is not that bad.
“How bad is it if I buy in at the wrong time?”
An excellent question, sensible reader. Let’s quantify the scale and duration of the downturns, and then contrast them against the booms:

By either definition of a downturn, downturns tend to last 1.1 years and the market regains its value in 3.2 years after a 17% decline.
How should we judge these results? A 17% decline in your biggest asset is certainly not good. Yet unless you need to sell, history argues that if you wait 3.2 years, the paper loss will be erased and the appreciation will continue again. How does this 17% decline compare with the stock market?

Quite favorably, as it turns out! The DJIA declines during the past three bear markets are twice as severe (36% decline vs. 17%). So if you are waiting for a housing crash before buying, where is your money? If it is the stock market, you will be even further behind by waiting to transfer assets from volatile stocks to more resilient real property.
“But what if I buy in at the best time, at the start of a boom?”
If you had omniscience (or great luck) and bought a Palo Alto property at the exact moment that a boom began, you’d feel pretty happy for a long time:
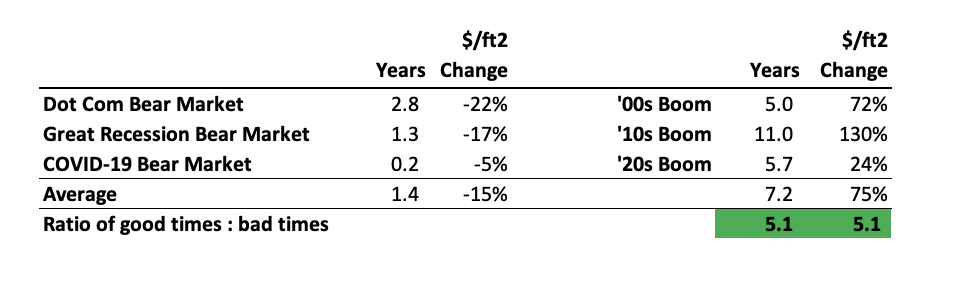
The upturns (noting that the current boom is still ongoing) last for an average of 7.2 years and see housing prices rise by 75%, which are both (remarkably) 5.1 times the duration and scale of the downturns.
“Well its settled then!” you say. “I’ll buy after the next crash”
We wish it was so easy! Its not obvious at all when a downturn or boom will actually happen. As a way to prove this empirically, let’s look at transaction volume around downturns.
People moving into Palo Alto tend to be really smart people doing something right in life. If smart people actually can time the market, we should expect no transactions just before and in the first half of a downturn. And furthermore, we should expect to see lots of transactions in the second half of a downturn. Does that data show this at all?
Depressingly, the chart above does not show strong evidence of this expected “smart buyer” behavior. Why aren’t people correctly only buying at the lowest point? Why do so many people continue to buy in the first half of a downturn, when they could gain a lot by waiting?
The answer of course, is that it’s never easy to know what will happen. In the most recent example, the short-lived COVID downturn, everyone was quite panicked in the early days. We just didn’t know that a boom was coming because everyone would want a home office and home theatre and home gym… we were too busy disinfecting our mail and wondering if the supply chain for meat was going to keep functioning.
Let’s consider an annualized view of the same data; do we see any trends once we remove the “scratchiness” that comes from the annual cycle of seasonality?
Transactions did obviously fall during the Great Recession, but the scale of the drop is not as dramatic as the “Great Depression stock price curve”. And why don’t we see 2009 and 2010 full of transactions with smart people all buying when the market is low? Because it’s never obvious at the time.
It’s really hard to time the market.
“Well, if its effectively impossible to time the market, what do you recommend? That I should just close my eyes and jump in?
The best time to buy into the market is when it is right for you and your family. Typical causes for a move include new schools, new jobs, a better commute, having the right features for your family’s changing needs, adding bedrooms for a new family member, divorce, marriage, death, and being close to family. Optimizing paper wealth is usually never a consideration, because it is hard to time the market, and because it is only paper wealth.
Most of the time, you will enjoy some portion of a boom, then a modest decline, then another boom. If history is any guide, the upswings will be five times bigger than the setbacks. Over longer periods of time, its shrewd to be exposed to the strong appreciation of the housing market. If you are using financing, you are getting tax-advantaged leverage as well. Unless you need to sell, an occasional decline in housing value can remain a paper downturn that is never realized. And waiting will result in missed appreciation much more often than a great buying opportunity.
Conclusions
Palo Alto buyers who are hopeful for a crash are likely to be disappointed. To the extent Palo Alto home prices ever crash, they do so in a relatively short and modest manner. If the past 28 years and three downturns are reliable guides, downturns are short (1.1 years of downturn, 3.2 years to return to a pre-downturn level) and relatively shallow (-17% home value decline). By contrast, the boom years enjoy durations of 7.2 years and appreciation of 75%. Because it is hard to time the market, it will typically be a better bet to just buy into a new home when it is the right time for your needs, rather than waiting for the best time, which is only obvious in hindsight.
About the Authors/Datamancers

The Young Platinum Group (aka Gloria and John) specializes in Palo Alto, Atherton, and surrounding areas. We work with buyers, sellers, and builders to enhance exceptional lives in the finest homes in the heart of Silicon Valley.
Would you like this sort of data on your side in your next real estate transaction? Or a complimentary analysis of what your home is worth in the current and ever-evolving market? Contact us to start.
This sort of original analytical work, customized on your behalf, with our fabled customer service, can be deployed for your needs to make your next move a smooth and happy one.
We proudly affiliate with Golden Gate Sotheby’s International Realty for our realty activities, and the Peninsula’s finest builders, architects, and designers for our development projects.